Building Real Observability into Cypress E2E Tests: A Step-by-Step Technical Guide with Testmo, Google Cloud, and Node.js
Learn how to improve Cypress E2E test observability with Testmo, Google Cloud, and Node.js. Explore failure screenshots, video artifacts, JUnit reporting, MongoDB readiness checks, and reliable CI/CD pipelines.
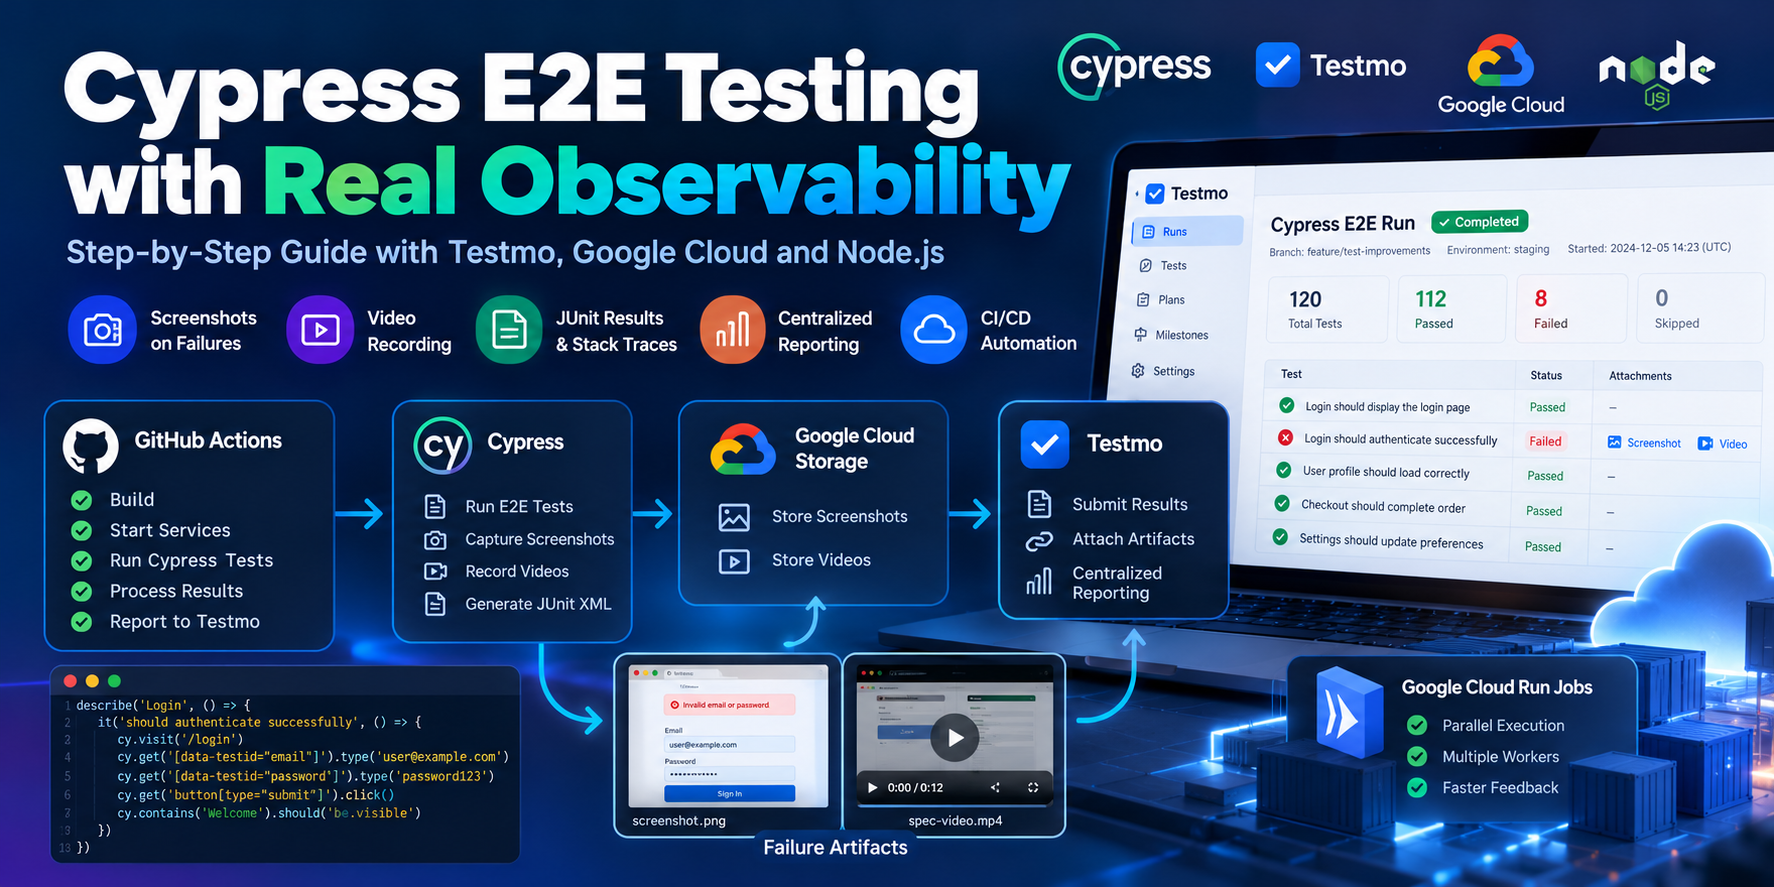
Learn how to enrich Cypress test results, store screenshots and videos of failed tests, detect infrastructure failures, and build a reliable CI/CD testing pipeline.
1. Introduction: Why Running Tests Is Not Enough
One common challenge in test automation is that understanding why a test failed can sometimes take longer than writing the test itself.
This becomes especially complicated when hundreds of end-to-end (E2E) tests are executed in parallel across multiple workers.
Imagine running Cypress tests in a CI environment:
Running: login.cy.js

  Authentication
    ✓ should display the login page
    1) should login successfully

  1 passing
  1 failing
We know that one test failed.
But how do we answer the following questions?
- Was the failure caused by an application defect?
- Did an API request fail?
- Did the page fail to load within the expected time?
- Did a dependent service crash before Cypress started?
- Is there a screenshot showing the exact moment of failure?
- Can we access the corresponding video recording?
- Which application version was tested?
If answering these questions requires searching through logs across multiple systems, our test automation infrastructure is missing an important capability.
What we need is not just test execution, but test observability.
In this tutorial, we will explore how to build a sample system using the following technologies:
| Technology | Purpose |
|---|---|
| Cypress | E2E test execution |
| Mocha JUnit Reporter | Generating JUnit XML results |
| Node.js | Artifact and reporting management |
| Testmo | Centralized test reporting |
| Google Cloud Storage | Screenshot and video storage |
| Google Cloud Run Jobs | Parallel test execution |
| MongoDB | Example dependent service |
| GitHub Actions | CI/CD automation |
Our goal is not simply to collect passing and failing test results. We want to make every test execution easier to investigate.
2. Setting Up Our Example Project
Let's start by creating a standalone Cypress project.
Open your terminal:
mkdir cypress-observability-demo
cd cypress-observability-demo

npm init -y

npm install --save-dev \
  cypress \
  mocha-junit-reporter \
  @testmo/testmo-cli

npm install \
  @google-cloud/storage \
  @xmldom/xmldom
Our project will have four main responsibilities:
- Execute tests using Cypress.
- Generate JUnit XML reports.
- Store visual evidence of failed tests.
- Submit test results to Testmo.
Example project structure
cypress-observability-demo/
│
├── cypress/
│   ├── e2e/
│   │   └── login.cy.js
│   ├── screenshots/
│   └── videos/
│
├── scripts/
│   ├── upload-artifact.js
│   ├── enrich-junit.js
│   └── verify-results.js
│
├── results/
│
├── cypress.config.js
└── package.json
Some of these directories will be created automatically when the tests run.
The results directory will contain our JUnit XML reports.
The scripts directory will contain Node.js utilities responsible for artifact management and reporting.
3. Configuring Cypress: JUnit, Screenshots, and Videos
First, let's configure Cypress to generate test results and capture failure artifacts.
Create or update cypress.config.js:
const { defineConfig } = require("cypress");

module.exports = defineConfig({
  video: process.env.CI === "true",

  screenshotOnRunFailure: true,

  screenshotsFolder: "cypress/screenshots",
  videosFolder: "cypress/videos",

  reporter: "mocha-junit-reporter",

  reporterOptions: {
    mochaFile: "results/test-results-[hash].xml",
    toConsole: false
  },

  e2e: {
    baseUrl: "https://example.com",

    setupNodeEvents(on, config) {
      on("after:spec", (spec, results) => {
        if (!results) return;

        console.log(`Completed: ${spec.relative}`);
        console.log(
          `Failures: ${results.stats.failures}`
        );

        if (results.video) {
          console.log(`Video: ${results.video}`);
        }
      });
    }
  }
});
What does this configuration do?
video
Enables video recording in CI environments while avoiding unnecessary video generation during local execution.
screenshotOnRunFailure
Automatically captures a screenshot when a test fails.
reporter
Generates test results in JUnit XML format, which can be processed by Testmo.
mochaFile
Creates separate XML result files using a unique hash in the filename.
after:spec
A Cypress Node.js event that executes after each spec file finishes.
This event gives us access to test statistics, screenshots, and video information.
An important detail is that after:spec executes in the Node.js process rather than inside the browser.
This makes it suitable for filesystem operations and cloud storage integrations.
4. Writing Our First E2E Test
Create cypress/e2e/login.cy.js:
describe("Login", () => {
  it("should display the login page", () => {
    cy.visit("/");

    cy.get("body").should("be.visible");
  });
});
Run the test:
npx cypress runAfter execution, Cypress should generate a JUnit XML file similar to:
results/
  test-results-abc123.xml
The contents may look like this:
<testsuite
  name="Login"
  tests="1"
  failures="0">

  <testcase
    name="should display the login page"
    classname="Login"
    time="0.8" />

</testsuite>
When a test fails, the XML contains a failure element.
For example:
<testcase
  name="should display the login page"
  classname="Login">

  <failure
    message="Expected element to be visible">
    AssertionError: Timed out
  </failure>

</testcase>
This XML file becomes the foundation of our reporting architecture.
Important: The example.com URL is only a placeholder for demonstration purposes. Replace it with the URL of your own test application when implementing a real scenario.
5. Uploading Failure Evidence to Google Cloud Storage
Our next goal is to store screenshots and videos independently of the test execution environment.
We will use Google Cloud Storage for this purpose.
Before continuing, make sure that the Cloud Storage API is enabled in your Google Cloud project, a private storage bucket exists, and the identity executing the tests has permission to upload objects.
For local development, Application Default Credentials can be used.
In CI environments, Workload Identity or the execution environment's service identity is generally preferable.
Creating an artifact upload helper
Create scripts/upload-artifact.js:
const { Storage } = require("@google-cloud/storage");
const fs = require("node:fs");
const path = require("node:path");

const storage = new Storage();

async function uploadArtifact(localPath, objectName) {
  const bucketName = process.env.ARTIFACT_BUCKET;

  if (!bucketName) {
    throw new Error("ARTIFACT_BUCKET is missing");
  }

  if (!fs.existsSync(localPath)) {
    throw new Error(`File not found: ${localPath}`);
  }

  const bucket = storage.bucket(bucketName);

  await bucket.upload(localPath, {
    destination: objectName,
    preconditionOpts: {
      ifGenerationMatch: 0
    }
  });

  return {
    bucket: bucketName,
    object: objectName,
    uri: `gs://${bucketName}/${objectName}`,
    filename: path.basename(localPath)
  };
}

module.exports = { uploadArtifact };
This function performs four operations:
- Verifies that the local file exists.
- Identifies the destination bucket.
- Uploads the file to the specified object path.
- Returns the file's location in Google Cloud Storage.
The ifGenerationMatch: 0 option helps prevent accidentally overwriting an existing object at the same destination.
Organizing artifacts
Instead of storing files with random names, we can establish a consistent directory structure.
For example:
artifacts/
  run-001/
    worker-0/
      login.cy.js/
        failure.png
        execution.mp4

    worker-1/
      checkout.cy.js/
        failure.png
        execution.mp4
This structure associates each artifact with a specific test run, worker, and spec.
In a production implementation, artifact paths should include unique execution identifiers to prevent naming conflicts.
Artifact upload failures should not block test results
async function uploadSafely(localPath, objectName) {
  try {
    return await uploadArtifact(localPath, objectName);
  } catch (error) {
    console.warn(
      `[ARTIFACT WARNING] ${error.message}`
    );

    return null;
  }
}
This represents an important architectural decision.
We should not lose an original test result simply because a screenshot could not be uploaded.
If artifact uploading fails, the test result should remain available, and the upload problem should be recorded separately.
This approach is commonly known as graceful degradation.
6. Collecting Evidence with the Cypress after:spec Event
We can now access screenshot and video files after each spec finishes.
Let's extend the setupNodeEvents section of our Cypress configuration using the following approach:
const { uploadArtifact } =
  require("./scripts/upload-artifact");

on("after:spec", async (spec, results) => {
  if (!results) return;

  const runId = process.env.RUN_ID || "local-run";
  const workerId = process.env.WORKER_ID || "worker-0";

  const failed =
    results.stats.failures > 0;

  if (!failed) return;

  const prefix =
    `runs/${runId}/${workerId}/${spec.relative}`;

  const files = [
    ...(results.screenshots || [])
      .map(item => item.path),

    ...(results.video ? [results.video] : [])
  ];

  for (const file of files) {
    try {
      const name =
        `${prefix}/${require("node:path").basename(file)}`;

      const result = await uploadArtifact(file, name);

      console.log(
        `[ARTIFACT] Uploaded: ${result.uri}`
      );
    } catch (error) {
      console.warn(
        `[ARTIFACT] Upload failed: ${error.message}`
      );
    }
  }
});
This is a basic example of uploading screenshots and videos from failed specs to a private storage bucket.
However, there is an important detail: A single spec file may contain multiple tests.
Therefore, knowing that screenshots belong to the same spec does not necessarily tell us which individual test each screenshot belongs to.
For a real project, we should create an artifact manifest that explicitly maps screenshots to individual test results.
For example:
{
  "runId": "run-001",
  "workerId": "worker-0",
  "spec": "cypress/e2e/login.cy.js",
  "tests": [
    {
      "title": "Login should display the login page",
      "status": "failed",
      "screenshotObject": "runs/run-001/worker-0/login/failure.png",
      "videoObject": "runs/run-001/worker-0/login/execution.mp4"
    }
  ]
}
The purpose of this manifest is to describe which artifact belongs to which test result.
Multiple tests may share the same spec-level video, but screenshot mapping must be accurate at the individual test level.
For large test suites, using Cypress test metadata is more reliable than attempting to identify test associations solely from filenames.
7. Adding Screenshot and Video Links to Testmo Results
Testmo supports test-level attachment properties in JUnit XML reports.
These properties allow us to associate externally stored artifacts with individual test results.
For example:
<testcase
  classname="Login"
  name="should display the login page">

  <properties>
    <property
      name="attachment1"
      value="https://storage.example.com/failure.png"/>

    <property
      name="attachment2"
      value="https://storage.example.com/execution.mp4"/>
  </properties>

  <failure message="Element not visible">
    AssertionError
  </failure>

</testcase>
There are two important considerations.
First: The artifact files are not uploaded directly to Testmo in this example. Testmo displays links to files stored in an external system.
Second: Users must have permission to access the URLs.
If we use private Google Cloud Storage, we must design an appropriate access mechanism.
Short-lived signed URLs are one option. However, those links expire.
For long-lived reports, an access-controlled artifact viewing service may be a more appropriate solution.
8. Enriching JUnit XML Using Node.js
Next, let's add artifact links to an existing JUnit XML file.
We will use the @xmldom/xmldom library.
To keep the example simple, the function will find a JUnit testcase by its name and add the corresponding attachment properties.
Create scripts/enrich-junit.js:
const fs = require("node:fs");
const { DOMParser, XMLSerializer } =
  require("@xmldom/xmldom");

function addAttachments(xmlPath, testName, urls) {
  const xml = fs.readFileSync(xmlPath, "utf8");

  const document = new DOMParser().parseFromString(
    xml,
    "application/xml"
  );

  const testcases =
    document.getElementsByTagName("testcase");

  for (let i = 0; i < testcases.length; i++) {
    const testcase = testcases.item(i);

    if (testcase.getAttribute("name") !== testName) {
      continue;
    }

    let properties = testcase
      .getElementsByTagName("properties")
      .item(0);

    if (!properties) {
      properties = document.createElement("properties");
      testcase.insertBefore(
        properties,
        testcase.firstChild
      );
    }

    urls.forEach((url, index) => {
      const property =
        document.createElement("property");

      property.setAttribute(
        "name",
        `attachment${index + 1}`
      );

      property.setAttribute("value", url);

      properties.appendChild(property);
    });
  }

  fs.writeFileSync(
    xmlPath,
    new XMLSerializer().serializeToString(document)
  );
}

module.exports = { addAttachments };
Example usage:
const { addAttachments } =
  require("./scripts/enrich-junit");

addAttachments(
  "results/test-results.xml",
  "should display the login page",
  [
    "https://example.com/failure.png",
    "https://example.com/execution.mp4"
  ]
);
This function adds attachment properties to the matching test case in the XML file.
The original failure element remains intact.
Production considerations
This utility is intended as an educational example.
In a real system, a test name alone may not be unique.
For example, two different test suites may contain tests with identical names.
For more reliable matching, consider combining:
- Spec file path
- Suite name or classname
- Test name
- Stable test identifier
- Retry or attempt information
XML parsing errors should also be handled, duplicate attachments should be prevented, and file updates should ideally be written atomically.
JUnit enrichment should take place after all artifact uploads have completed and before the results are submitted to Testmo.
9. Submitting Results to Testmo
At this stage, we have JUnit XML reports and artifact links associated with test results.
The next step is to submit them to Testmo.
The Testmo CLI can process JUnit XML files and create automation results in Testmo.
Creating our first Testmo automation run
Assume the following environment variables are configured:
export TESTMO_INSTANCE="https://your-instance.testmo.net"
export TESTMO_PROJECT_ID="1"
The TESTMO_TOKEN variable must also be configured securely.
Never hardcode real API tokens into source files.
We can then run:
npx testmo automation:run:submit \
  --instance "$TESTMO_INSTANCE" \
  --project-id "$TESTMO_PROJECT_ID" \
  --name "Cypress-E2E-Demo" \
  --source "cypress" \
  --results "results/*.xml"
This command:
- Creates a new automation run in Testmo.
- Reads the JUnit XML files.
- Submits the test results.
- Completes the run.
If the XML contains supported attachment properties, Testmo can display the corresponding external links in the test results.
A different approach for parallel execution
When using multiple workers, creating a separate automation run for every worker is generally not ideal.
Instead, we can submit multiple threads under a single automation run.
First, create the run:
npx testmo automation:run:create \
  --instance "$TESTMO_INSTANCE" \
  --project-id "$TESTMO_PROJECT_ID" \
  --name "Cypress-Parallel-E2E" \
  --source "cypress"
This command returns the ID of the newly created run.
The CI orchestrator should capture this ID and make it available to all workers.
Each worker then submits its own results:
npx testmo automation:run:submit-thread \
  --instance "$TESTMO_INSTANCE" \
  --run-id "$TESTMO_RUN_ID" \
  --results "results/*.xml"
Once all workers have finished:
npx testmo automation:run:complete \
  --instance "$TESTMO_INSTANCE" \
  --run-id "$TESTMO_RUN_ID"
One important detail: Completing an automation run does not automatically prove that all workers executed successfully.
The CI system must independently verify worker exit codes and generated result files.
10. The Most Critical Rule: A Pipeline Must Not Appear Successful When No Tests Were Executed
Let's examine a scenario that can be difficult to detect in test automation infrastructure.
Consider the following logs:
[INFO] Starting database service...
[ERROR] Database connection timeout

[ERROR] Cypress execution failed

[INFO] Uploading results...
[WARN] No valid JUnit files found

[INFO] Reporting operation completed
The last line suggests that the reporting process completed successfully.
However, the real problem is that Cypress never executed any tests.
Therefore, the overall execution must not be considered successful.
10.1 Verify that JUnit files were generated
Create scripts/verify-results.js:
const fs = require("node:fs");
const path = require("node:path");

const resultsDirectory = path.resolve("results");

if (!fs.existsSync(resultsDirectory)) {
  console.error(
    "[CI ERROR] Results directory does not exist."
  );

  process.exit(1);
}

const files = fs.readdirSync(resultsDirectory)
  .filter(file => file.endsWith(".xml"));

if (files.length === 0) {
  console.error(
    "[CI ERROR] No JUnit XML files generated."
  );

  process.exit(1);
}

console.log(
  `[CI OK] Found ${files.length} JUnit files.`
);
Run it:
node scripts/verify-results.jsExpected output:
[CI OK] Found 4 JUnit files.Or:
[CI ERROR] No JUnit XML files generated.In the second case, the process exits with code 1.
This allows the CI environment to detect the failure.
10.2 Is the existence of an XML file sufficient?
No.
An empty, invalid, or stale XML file from a previous execution may also produce misleading results.
Production-level validation should check:
- Does the XML file exist?
- Can it be parsed successfully?
- Does it contain valid test results?
- Does it belong to the current execution?
- Did the expected shard actually execute tests?
For example, a JUnit report containing zero tests:
<testsuite
  name="E2E Tests"
  tests="0"
  failures="0">
</testsuite>
This XML is syntactically valid, but it does not prove that the expected tests ran.
The zero tests executed scenario must be handled explicitly in automated testing systems.
11. Preserving the Actual Cypress Exit Code
Another common CI problem is that a failed test command can be masked by a subsequent successful command.
For example:
npx cypress run
echo "Execution completed"
Even if the Cypress command fails, the final command may succeed.
This can cause the script to return a successful exit code.
Therefore, exit code handling must be explicit.
A reliable Bash example
#!/usr/bin/env bash

set -uo pipefail

rm -rf results
mkdir -p results

set +e
npx cypress run
CYPRESS_EXIT_CODE=$?
set -e

echo "Cypress exit code: $CYPRESS_EXIT_CODE"

node scripts/verify-results.js
VERIFY_EXIT_CODE=$?
There is a subtle but important detail here.
When set -e is enabled again, a failed validation command may terminate the script immediately.
This behavior is sometimes desirable.
However, if we want to continue reporting test results after failures, we need to capture exit codes in a controlled manner.
A better example is:
#!/usr/bin/env bash

set -uo pipefail

rm -rf results
mkdir -p results

npx cypress run
CYPRESS_EXIT_CODE=$?

node scripts/verify-results.js
VERIFY_EXIT_CODE=$?

if [ "$VERIFY_EXIT_CODE" -ne 0 ]; then
  echo "Infrastructure/report generation failure"
  exit 1
fi

# Valid XML results can be submitted to Testmo here.
# The Testmo CLI exit code should also be verified.

exit "$CYPRESS_EXIT_CODE"
The main purpose of this script is simple:
When Cypress fails, a later successful command must not accidentally convert the original execution failure into a successful pipeline result.
In a real CI pipeline, the Testmo upload exit code must also be checked, and reporting failures must remain visible.
12. MongoDB Readiness: A Running Service Is Not Necessarily a Ready Service
E2E tests often depend on databases, APIs, test data services, or other infrastructure components.
These services may require time to initialize.
Consider the following sequence:
00:00 Node.js process started
00:01 HTTP server listening
00:03 MongoDB connection pending
00:08 MongoDB connection pending
00:12 MongoDB connected
If the test runner only checks whether the HTTP port is open, it may start executing tests at the first second.
However, MongoDB does not become ready until the twelfth second.
This timing difference can cause intermittent startup failures.
12.1 Creating a readiness endpoint
Consider a sample Node.js service:
const http = require("node:http");
const mongoose = require("mongoose");

const server = http.createServer((req, res) => {
  if (req.url !== "/health") {
    res.writeHead(404);
    res.end();
    return;
  }

  const isReady = mongoose.connection.readyState === 1;

  res.writeHead(isReady ? 200 : 503, {
    "Content-Type": "application/json"
  });

  res.end(JSON.stringify({
    status: isReady ? "ready" : "not_ready"
  }));
});

server.listen(3000, () => {
  console.log("Health server listening");
});
Before MongoDB is connected:
HTTP/1.1 503 Service Unavailable
Content-Type: application/json

{"status":"not_ready"}
After MongoDB is connected:
HTTP/1.1 200 OK
Content-Type: application/json

{"status":"ready"}
This example uses mongoose.connection.readyState to determine readiness.
In a real application, the readiness endpoint may need to represent the health of all critical dependencies required by the service.
12.2 Adding retry logic for MongoDB connections
A service may not always establish a database connection on the first attempt.
We can introduce a controlled retry mechanism.
const mongoose = require("mongoose");

const MAX_ATTEMPTS = 5;
const RETRY_DELAY_MS = 3000;

const sleep = ms =>
  new Promise(resolve => setTimeout(resolve, ms));

async function connectWithRetry(mongoUri) {
  for (let attempt = 1; attempt <= MAX_ATTEMPTS; attempt++) {
    try {
      console.log(
        `MongoDB connection attempt ${attempt}`
      );

      await mongoose.connect(mongoUri, {
        serverSelectionTimeoutMS: 5000
      });

      console.log("MongoDB connected");
      return;
    } catch (error) {
      console.error(
        `Attempt ${attempt} failed: ${error.message}`
      );

      if (attempt === MAX_ATTEMPTS) {
        throw error;
      }

      await sleep(RETRY_DELAY_MS);
    }
  }
}

module.exports = { connectWithRetry };
This example attempts to establish the connection a limited number of times.
If the final attempt fails, the error is propagated to the calling process.
It is important to distinguish between two different timeout concepts:
Connection attempt timeout: The maximum duration of an individual MongoDB connection attempt.
Overall startup timeout: The maximum time allowed for the complete initialization process.
Real CI systems should also enforce an overall startup deadline so that retries and other initialization operations cannot continue indefinitely.
12.3 Starting tests only when the service is ready
The following Bash script waits for the /health endpoint:
#!/usr/bin/env bash

set -euo pipefail

HEALTH_URL="http://localhost:3000/health"
MAX_ATTEMPTS=30

for ((i=1; i<=MAX_ATTEMPTS; i++)); do
  if curl -fsS "$HEALTH_URL" >/dev/null; then
    echo "Service is ready."
    exit 0
  fi

  echo "Waiting for service... Attempt $i"
  sleep 2
done

echo "ERROR: Service readiness timeout."
exit 1
This script:
- Calls the health endpoint.
- Continues when the HTTP response indicates success.
- Retries when the service is not ready.
- Fails after reaching the configured maximum number of attempts.
This is more reliable than introducing an arbitrary delay such as sleep 30.
If the service becomes ready earlier, no additional waiting is necessary.
If the service remains unavailable, the script produces a clearly defined failure.
13. Running Tests in Parallel with Google Cloud Run Jobs
Executing a large E2E suite in a single process can significantly increase overall execution time.
Imagine we have 300 tests.
We want to distribute them across three workers.
             Cloud Run Job
                   |
       +-----------+-----------+
       |           |           |
    Worker 0    Worker 1    Worker 2
       |           |           |
    100 tests   100 tests   100 tests
       |           |           |
       +-----------+-----------+
                   |
                Testmo Run
This is a conceptual distribution.
Actual execution time does not decrease proportionally with the number of workers because individual tests have different durations.
Cloud Run task indexes
Google Cloud Run Jobs can provide an index for each task.
We can use this information to distribute test files.
const taskIndex = Number(
  process.env.CLOUD_RUN_TASK_INDEX || "0"
);

const taskCount = Number(
  process.env.CLOUD_RUN_TASK_COUNT || "1"
);

console.log({
  taskIndex,
  taskCount
});
For example:
Task 0 → Test group A
Task 1 → Test group B
Task 2 → Test group C
Cypress does not automatically distribute tests based on these task indexes.
We need an additional sharding script or spec assignment mechanism.
A simple spec distribution algorithm
function assignSpecs(specs, taskIndex, taskCount) {
  return specs.filter(
    (_, index) => index % taskCount === taskIndex
  );
}

const specs = [
  "login.cy.js",
  "checkout.cy.js",
  "profile.cy.js",
  "search.cy.js",
  "settings.cy.js",
  "orders.cy.js"
];

console.log(assignSpecs(specs, 0, 3));
Output:
[
  "login.cy.js",
  "search.cy.js"
]
This technique is known as round-robin distribution.
It is simple to implement, but it does not account for differences in test execution time.
More advanced systems can distribute tests based on historical execution durations.
For example, a test that takes 10 seconds should not necessarily be treated as having the same weight as a test that takes five minutes.
14. Classifying Failures in the Test Pipeline
Let's bring the mechanisms we have developed together.
We can define three main failure categories.
Test failure
Cypress started: YES
JUnit generated: YES
Assertion failures: 3

Classification: TEST_FAILURE
In this scenario, we expect Testmo to report three failed tests.
Infrastructure failure
Cypress started: NO
JUnit generated: NO
Database ready: NO

Classification: INFRASTRUCTURE_FAILURE
We cannot claim that any application test failed in this scenario.
The tests never executed.
Reporting failure
Cypress started: YES
JUnit generated: YES
Results valid: YES
Testmo upload: FAILED

Classification: REPORTING_FAILURE
In this case, valid test results exist, but reporting failed.
Separating these failure categories makes investigations significantly easier.
A simple classification function
function classifyExecution(result) {
  if (!result.hasValidResults) {
    return "INFRASTRUCTURE_FAILURE";
  }

  if (!result.reportingSucceeded) {
    return "REPORTING_FAILURE";
  }

  if (result.testFailures > 0) {
    return "TEST_FAILURE";
  }

  return "SUCCESS";
}
Example usage:
const status = classifyExecution({
  hasValidResults: true,
  reportingSucceeded: true,
  testFailures: 2
});

console.log(status);
// TEST_FAILURE
This simplified classification treats missing valid test results as an infrastructure failure.
In a real project, test selection, test runner exit codes, and report generation problems should be evaluated using separate signals.
Also, test failures and reporting failures can occur simultaneously.
Production systems may benefit from preserving multiple failure categories rather than assigning only one status.
15. Designing the CI/CD Pipeline
Now let's combine everything into a single workflow.
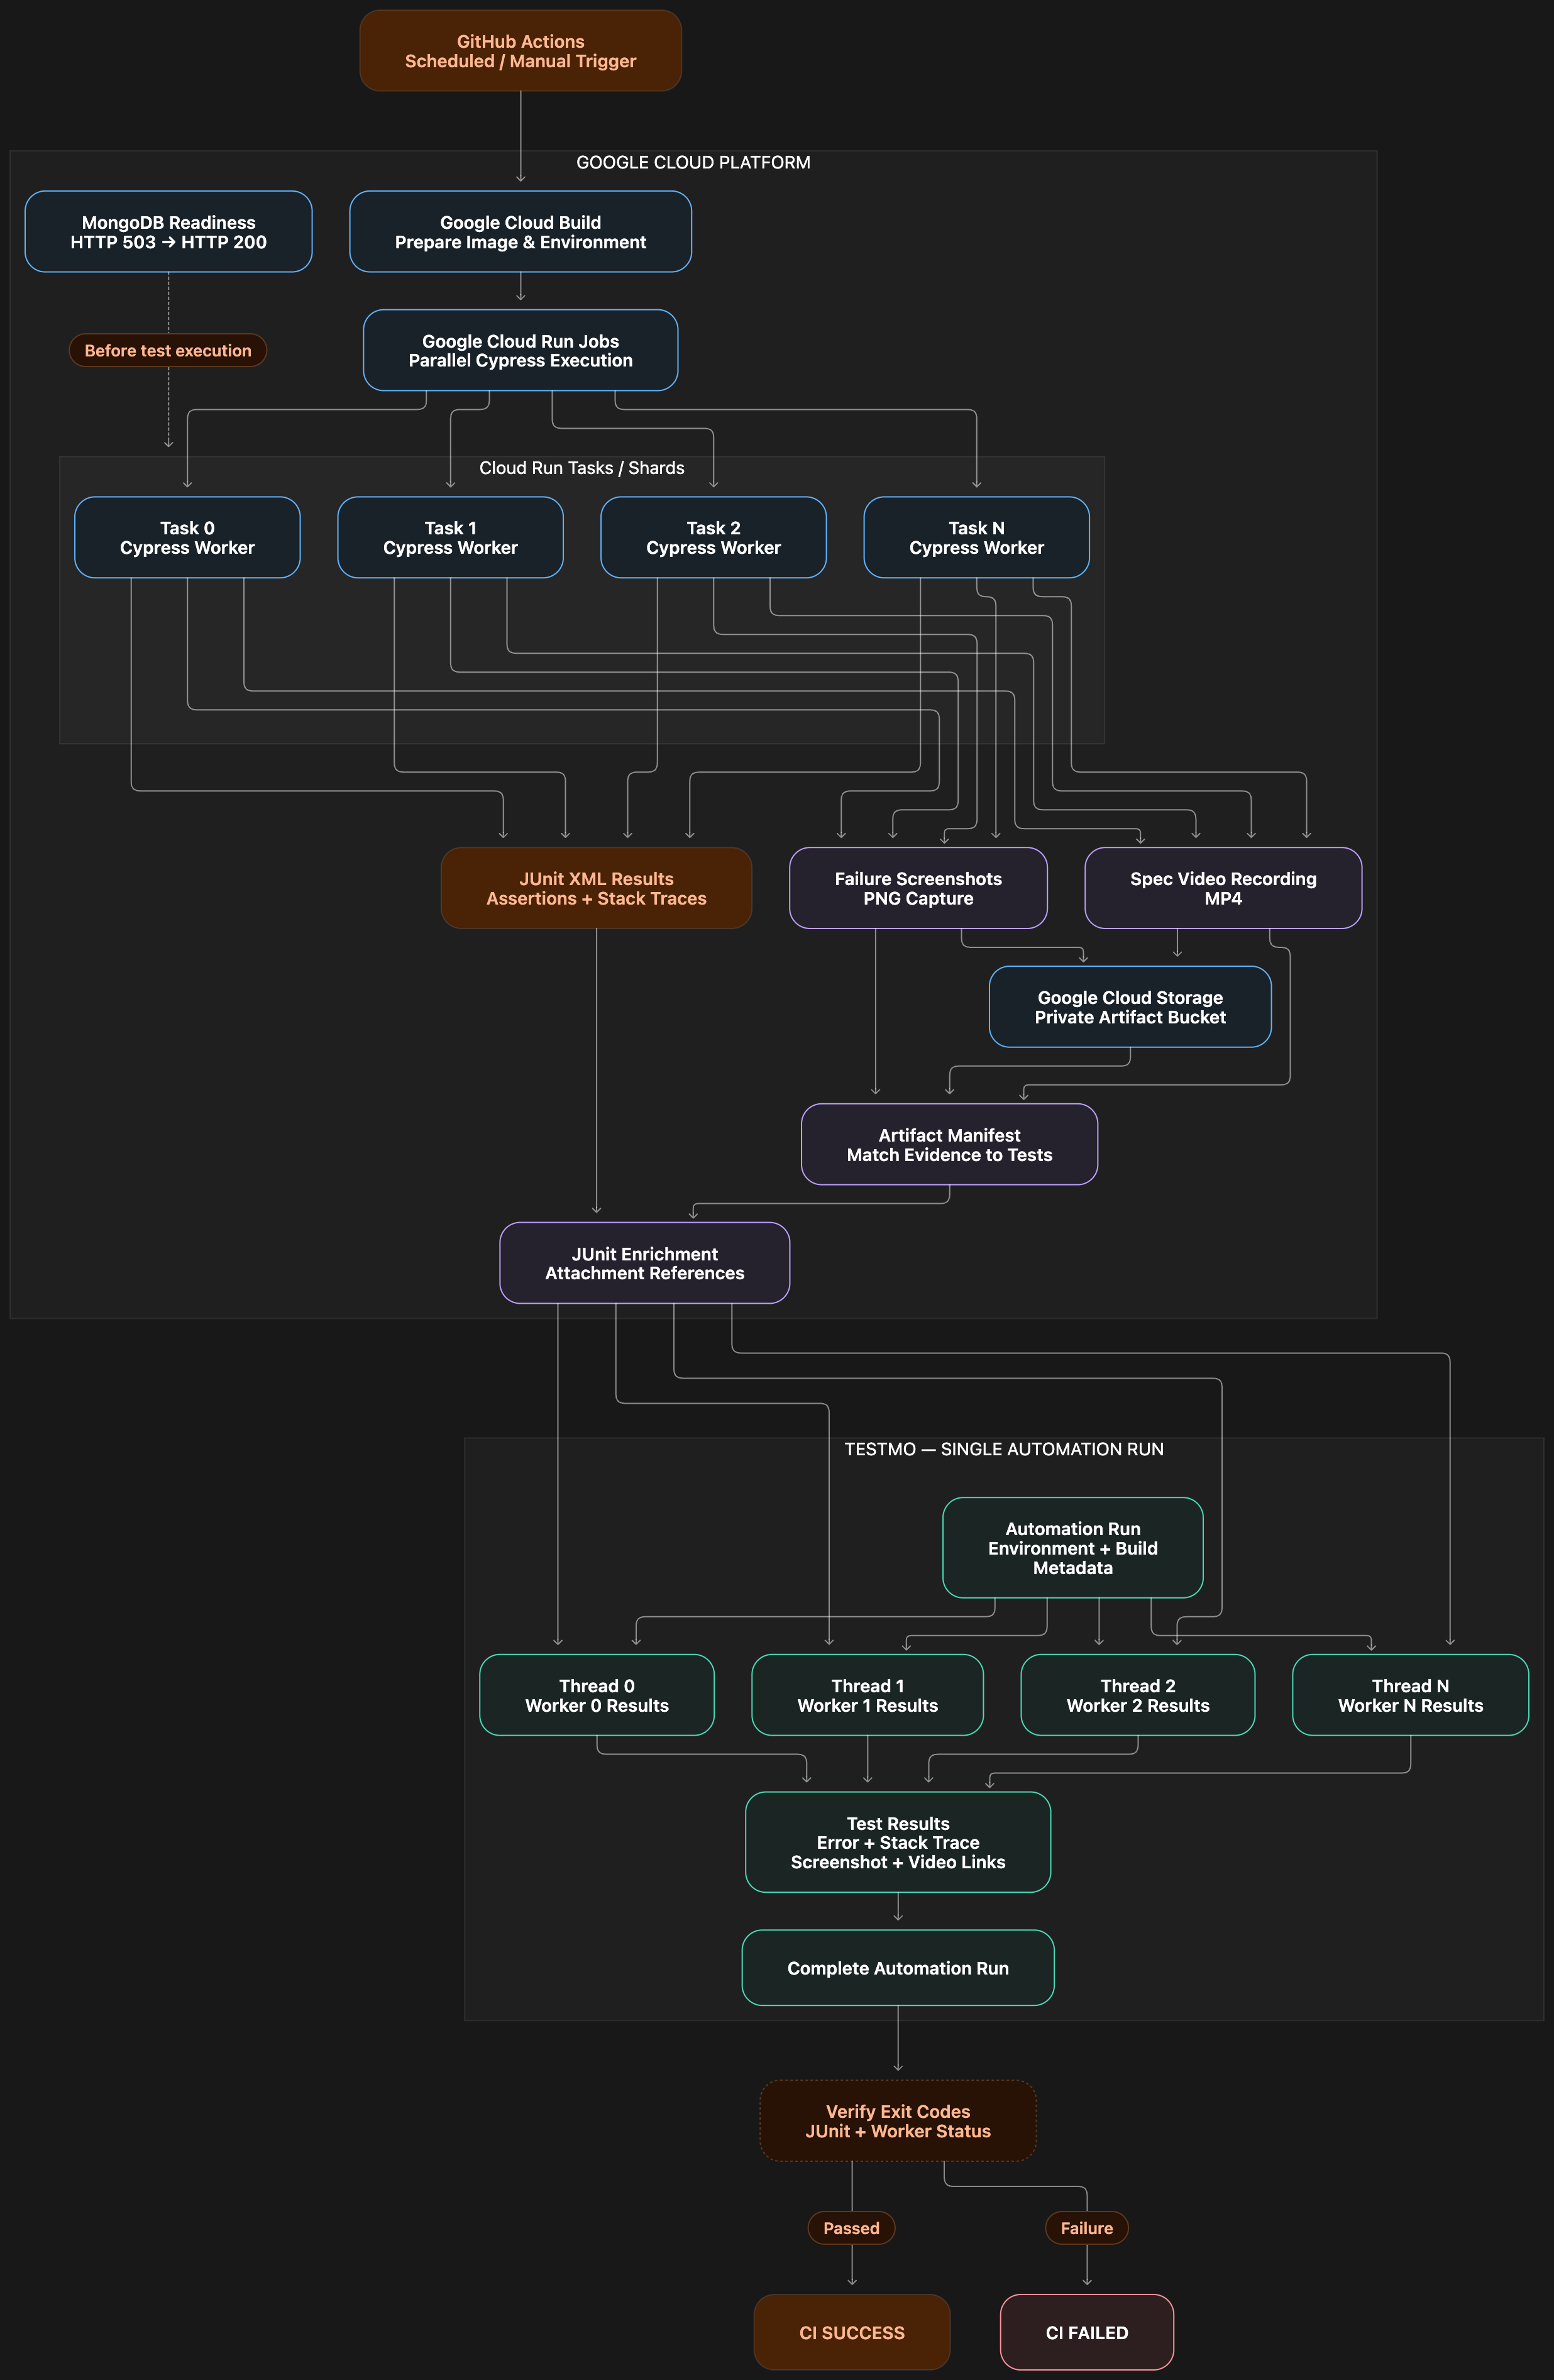
Our target architecture looks like this:
Source Code
     |
     v
GitHub Actions
     |
     v
Build / Prepare Environment
     |
     v
Start Required Services
     |
     v
Readiness Checks
     |
     v
Execute Cypress Tests
     |
     +----------------------+
     |                      |
     v                      v
JUnit XML              Screenshots / Videos
     |                      |
     |                      v
     |                Cloud Storage
     |                      |
     +----------+-----------+
                |
                v
        Enrich JUnit Results
                |
                v
           Testmo CLI
                |
                v
        Verify CI Exit Codes
                |
                v
           Final CI Status
The order of operations is critical in this architecture.
First, we ensure that required services are ready.
Next, we execute the tests.
After execution, we collect visual evidence and enrich the JUnit XML reports when necessary.
The results are then submitted to Testmo.
Finally, the pipeline evaluates test execution outcomes, infrastructure health, and reporting status together.
Completing a Testmo automation run is not the same as successfully completing a CI job.
16. What Should We Test in a Real Project?
After building this system, a single successful test execution is not enough.
The reporting and failure management components should also be tested independently.
Here is an example test matrix:
| Scenario | Expected behavior |
|---|---|
| Test passes | Successful JUnit result |
| Assertion fails | JUnit failure is preserved |
| Screenshot is missing | Original test result is preserved |
| Video is missing | Original test result is preserved |
| GCS upload fails | Warning is generated |
| XML is not generated | CI execution fails |
| XML is invalid | Reporting validation fails |
| MongoDB is not ready | Cypress does not start |
| MongoDB connection is delayed | Readiness check waits |
| Testmo API is unavailable | Reporting failure is recorded |
| Worker executes no tests | Empty-shard policy is applied |
| Two tests have identical names | Incorrect artifact association is prevented |
Writing unit tests for artifact helper functions is particularly valuable.
These tests allow us to identify logical problems without running the complete Cypress suite or cloud infrastructure after every change.
A simple Node.js unit test example
Let's use Node.js's built-in test runner:
const test = require("node:test");
const assert = require("node:assert/strict");

function classifyExecution(result) {
  if (!result.hasValidResults) {
    return "INFRASTRUCTURE_FAILURE";
  }

  if (!result.reportingSucceeded) {
    return "REPORTING_FAILURE";
  }

  if (result.testFailures > 0) {
    return "TEST_FAILURE";
  }

  return "SUCCESS";
}

test("detects missing test results", () => {
  const status = classifyExecution({
    hasValidResults: false,
    reportingSucceeded: true,
    testFailures: 0
  });

  assert.equal(
    status,
    "INFRASTRUCTURE_FAILURE"
  );
});

test("detects assertion failures", () => {
  const status = classifyExecution({
    hasValidResults: true,
    reportingSucceeded: true,
    testFailures: 2
  });

  assert.equal(status, "TEST_FAILURE");
});
Run the tests using:
node --testThis allows infrastructure classification and similar helper logic to be validated independently.
17. Security and Production Considerations
The code examples in this tutorial are intended to demonstrate the underlying concepts.
A real production environment requires additional security and reliability measures.
Artifact security: Screenshots and videos should be stored in private storage. Public-read access should not be the default solution.
Access control: Only authorized users should be able to access visual evidence associated with test results.
Secret management: API tokens and service credentials should be stored separately from source code.
Log management: Logs must not expose sensitive information.
Retry policies: Infrastructure retries should be controlled and bounded. Unlimited retries must not be used to hide genuine application failures.
Test isolation: Parallel workers should not interfere with one another's test data.
Result validation: Missing XML files, malformed XML, zero-test executions, and missing worker results should be handled separately.
Artifact lifecycle: Define retention periods and automated cleanup policies for screenshots and videos.
18. Key Technical Lessons Learned
There are several important principles to consider when designing this type of test automation architecture.
1. Separate assertion failures from infrastructure failures
When a test execution fails, first verify whether the expected tests actually ran.
2. Support test results with visual evidence
Screenshots, videos, and stack traces provide complementary information and make debugging more effective.
3. Treat JUnit XML as more than an output file
JUnit XML is a standardized data exchange format that allows different automation and reporting systems to communicate.
4. Verify that dependent services are ready
An open port does not necessarily mean a service is operationally ready.
5. Take CI exit code management seriously
A failed test command must not be hidden by subsequent successful commands.
6. Design artifact handling to tolerate failures
A screenshot upload failure should never erase the original test result.
7. Consolidate distributed test results into one report
Parallel execution should not force engineers to investigate disconnected reports.
8. Test your own automation infrastructure
Do not evaluate test framework reliability solely through application test results.
Reporting, readiness checks, artifact processing, and failure classification mechanisms should also be tested.
Conclusion
Writing E2E tests with Cypress is relatively straightforward.
However, building a reliable test automation system becomes a much more complex engineering challenge when hundreds of tests execute across multiple workers and depend on several services and cloud components.
In this tutorial, we explored the building blocks of a more observable testing architecture using Cypress, Node.js, Testmo, Google Cloud Storage, and MongoDB readiness checks.
We focused on four key improvements:
- Verifying that tests actually executed
- Supporting failed tests with visual evidence
- Separating infrastructure failures from test failures
- Consolidating distributed test results into a centralized reporting system
These improvements do more than enhance reporting.
They also increase confidence in automation results and make failure investigations more efficient.
A good test automation system does more than detect failures. It provides the information engineers need to understand why those failures occurred.
Technologies: Cypress, JavaScript, Node.js, Testmo, JUnit XML, Google Cloud Storage, Google Cloud Run Jobs, MongoDB, GitHub Actions.
Topics: QA Automation, Test Observability, Test Reliability, Failure Investigation, CI/CD, Distributed Testing, Infrastructure Readiness.
Flow Charts